
The pollution levels are rising day by day. It has become almost impossible to breathe clean air in many cities around the world due to alarming pollution levels in urban areas. It has become quite challenging to find optimal air quality to perform physical activities outside. However, newer Air Quality monitoring apps can help schedule your activities in optimal air quality times and will assist in picking outdoor exercise times that have a minimal effect on your health.
Our experience in the world of connected devices (IoT) has allowed us to build solutions for many sectors in both Private and Public domains. Our solution leverages cloud technology for reliability, security of data and system response time. The Mobile User Interface has been designed to be dynamic, adaptive, multilingual and have all logic configured for changing environments and mobile application specific needs (Android, iOS and Responsive).
We leverage advancements in machine learning which allows us to get new answers to old problems for trending and predictive health purposes. By cross-correlating ailments with unique data sets such as weather, pollutants, pollen indicators and/or reported environmental conditions, we can help proactively uncover new links between a person’s environment and their health challenges. Combining real time and historical data, we have everything we need to analyze and model the impact of local conditions on health for individuals.
What can be measured?
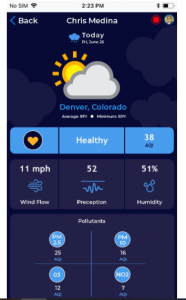
The Air Quality Index (AQI) is used for reporting daily air quality. It tells how clean or polluted your air is and what associated health effects might be a concern. The AQI focuses on health effects you may experience within a few hours or days after breathing polluted air.
The AQI covers a scale from 0 to 500 and is most commonly based on a weighted calculation of six (6) primary pollutants: ozone (O3), particulate matter of less than 2.5 micrometers (pm2.5), particulate matter of less than 10 micrometers (pm10), Carbon Monoxide (CO), Nitrogen Dioxide (NO2) and Sulphur Dioxide (SO2). The pollutants ozone, PM 2.5 and PM 10 are the most common.
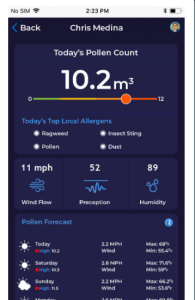
Our solution has interactive bi-directional communication with its users. By collecting real-time information submitted by users we can continue to fine tune models detecting pollutants, high pollen or dirty air (chemicals, toxic gases etc.). Then provide helpful recommendations to users based on pre-set preferences that can send pre-notifications, public announcements, and even connect to Smart devices like inhalers, Alexa, Siri or smart watches.
 Mobile Application
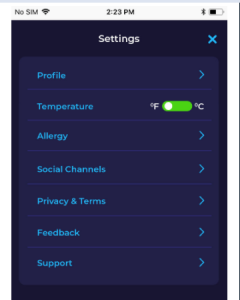
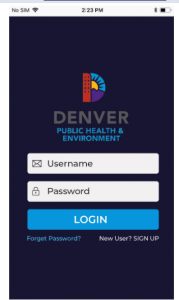
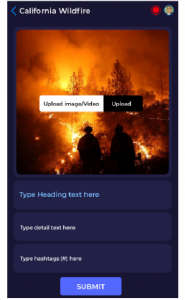
Clovity and our mobile engineers will design, develop, test and deploy an Air Quality mobile application specific to the use case. These will be both android and iOS compatible or built as a responsive/dynamic design application for further community usage and engagement. As with all our mobile applications, the solution will be deploy-able in English and Spanish as well as meeting ADA compliance requirements. The full solution will encompass two-factor authentication, notifications, interactions with 3rd parties, ability to upload and take pictures/videos as well as provide user preferences for trending of data and dashboard look/feel.
Whether you need a full map image or weather tiles to overlay onto third-party mapping libraries, Clovity has you covered. We offer a wide variety of weather layers for your maps ranging from basic radar and satellite for meteorological data to more advanced imagery such as fires/sandstorms, traffic congestion. We can even include anthropogenic emission sites, machine learning produced forecast models, and road conditions through the layer functions of your choice.
Advanced Geospatial and location search capabilities combined with high-resolution weather data ensures you only get the info you need, all right at your fingertips.
We employ the best practices for data management and analytic tools meaning that time is spent understanding as well as learning from the reports that are generated, versus cumbersome, hard-to-understand reports.
All reporting is available in real time and can be exported to a pdf or other files as users prefer. Our experts deploy the latest in Business Intelligence tools and interactive dashboards. With dynamic data visualization, maps become interactive and can allow users to set preferences for alerts, notifications and even access third party information for planning or forecasting purposes. Our visualization can even work with Augmented Reality to overlay data with weather images.
Available Air Quality Information
The Air Quality API Forecasts endpoint provides information for locations globally. This endpoint provides daily and hourly forecast data up to 4 days. Forecast data can then be interpolated for the exact location queried. Available information includes the air quality index (AQI), category, dominant pollutant, and information for primary pollutants when available.
The air quality forecast endpoint, currently in public beta, provides forecast information for up to the next 4 days. For the initial phase, forecasts will be available in a specific geographical region and daily timeframe or custom intervals, such as hourly or three (3) hour intervals.
Individual Air Quality station endpoints are monitored with this solution, providing a bird-eye view of a single station or consolidated view of all stations and metrics.
Coupled with our machine learning and AI capabilities, based on a user’s preference, the solution will be able to make recommendations based on real time insights and provide trending information for future planning. The collected data will allow for greater awareness of hazardous or poor air quality that is better communicated to the community at large.
All dashboards and reporting will be accessed by users by role (i.e. – general public, public official, operations and support). All users will have the ability to personalize their dashboards and all reporting will have the ability to export.
California Fires: Case in Point
California fires are getting worse each year. Monitoring for dangerous pollutants being caused by wildfires is a critical components of the value proposition for this solution. Molecules like carbon monoxide, carbon dioxide, and nitrous oxide can pose significant risks to first responders and those that live nearby or downwind. These gases can severely affect people’s health and are emitted in droves during forest fires as result of combustion of huge amounts of biomass. The system is able to produce real time alerts that are activated according to the latest disaster events and weather patterns. By ensuring people are warned as quickly as possible to potential fire or air quality danger, easier coordination of evacuation operations and a decreased demand on emergency teams could be quickly realized.
Through intuitive dashboard UIs and map interfaces, all of this data is readily depicted to derive the best statistics.
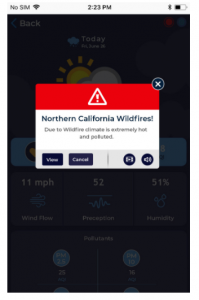
Our Android/IOS mobile application represents locations of IoT devices, measures and averages for each pollutant variable monitored through graphical visualizations that users can interpret easily. Moreover, this application is responsible for synchronizing notifications and activating alerts that have been sent from the server (when a recent measure registers a potential hazard for the generation of an emergency situation). Users can also access a bar chart that represents the real time averages of measurements for each atmospheric variable or pollutant gases.
However, another important element is the alert control panel. This section represents all notifications and alerts activated from the server when a measurement involves a level of danger for forest fires generation. Each notification received informs the users about the exact zone associated with the danger, the variable and a description to identify which alert level has been increased.
Using the technology that is readily available today, cities and technology providers can become stewards of the air quality for their populace. While only some measures can be taken preemptively, the ability to react quickly can be the difference. Our connected world is evolving to be more conscious, nothing is more important than the air we breath each day. We must starting using these technologies to help us in our fight against an ever growing and ever changing world.
By Bhawna Vats, Director of Operations @ Clovity, November 11th, 2020