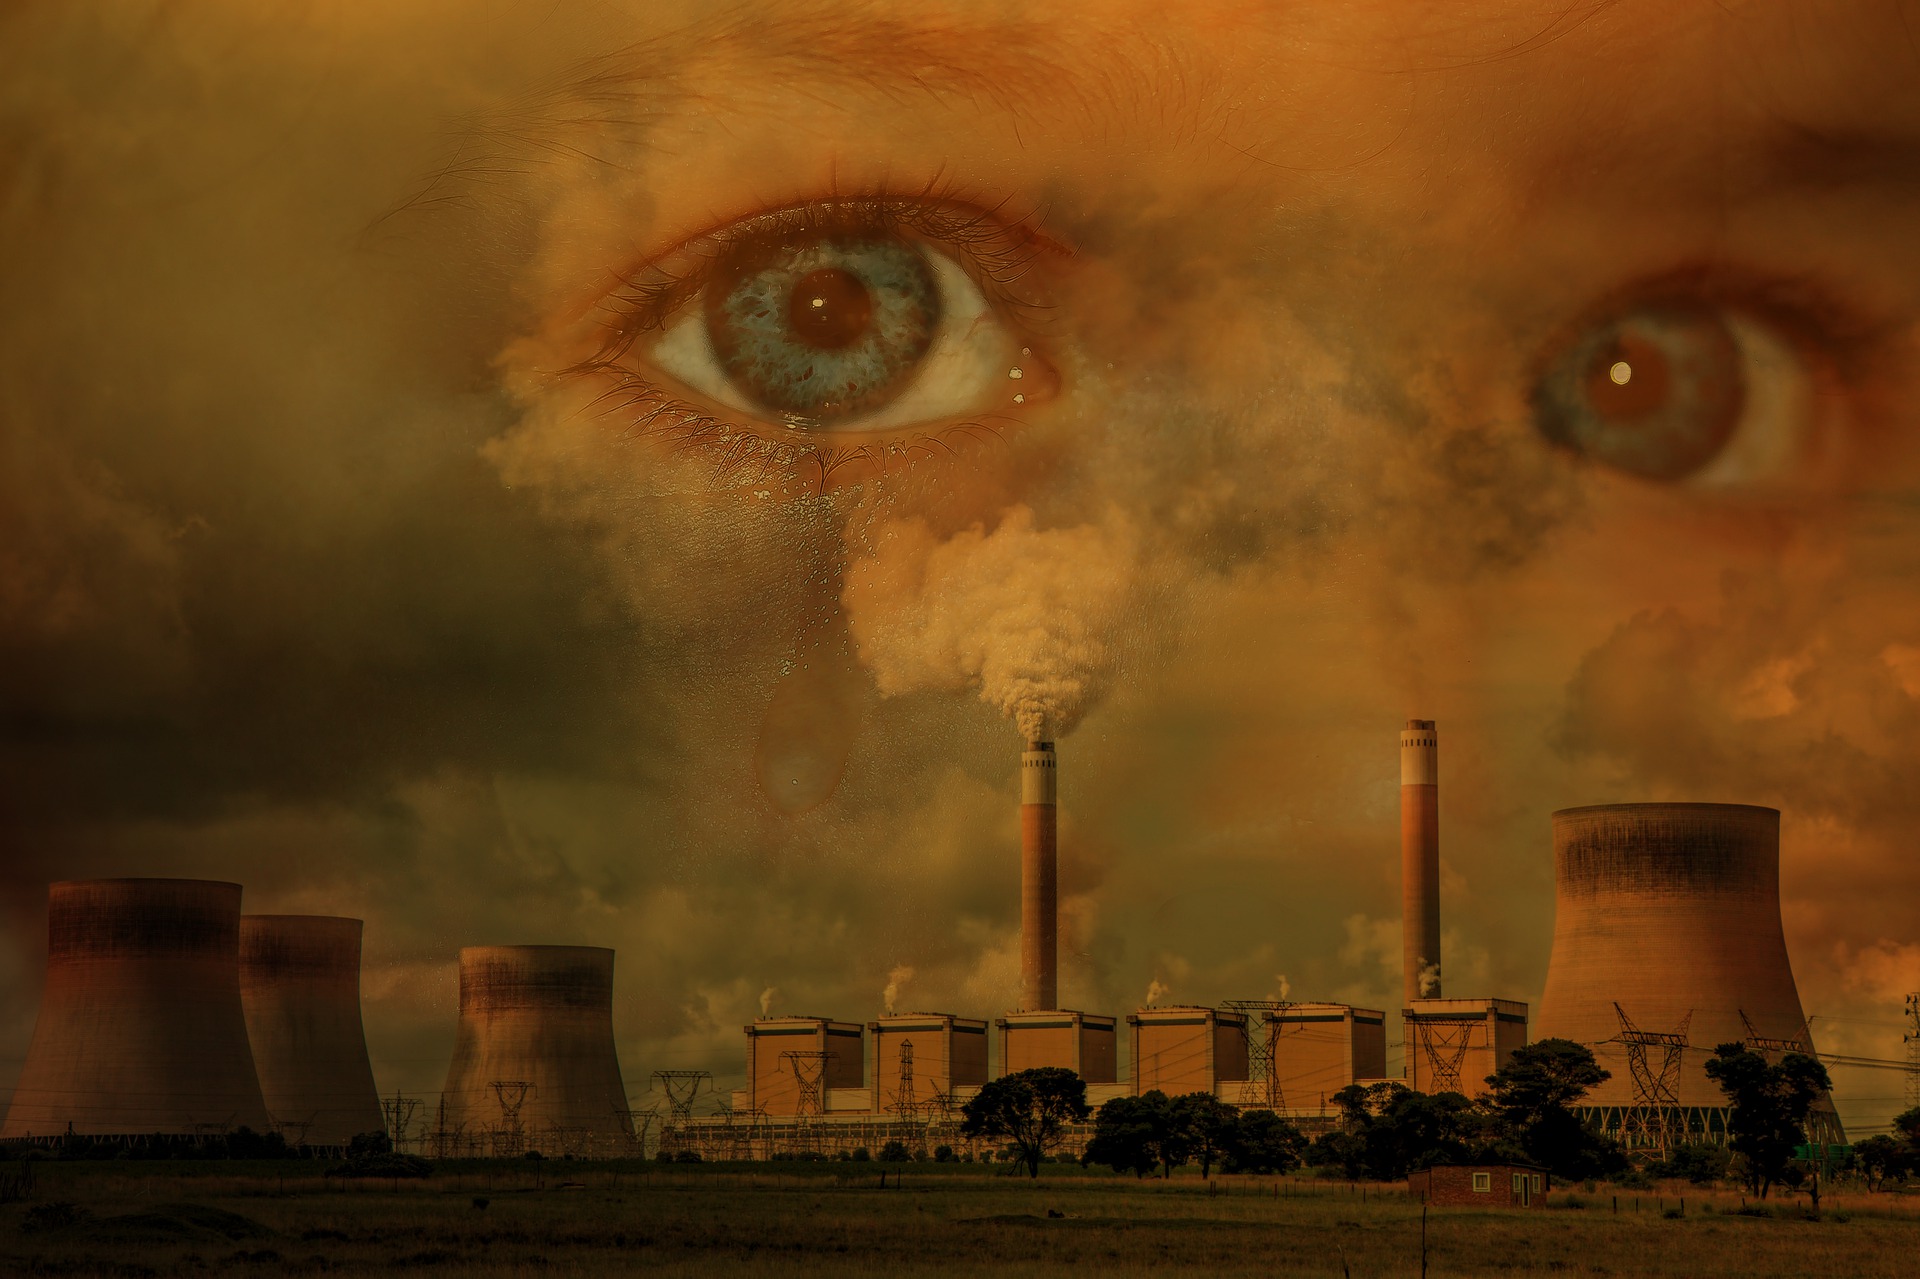
Atmospheric conditions continue to deteriorate each year due to the growth of civilization and increasing unclean emissions from industries and automobiles. Although air is an indispensable resource for life, many people are indifferent to the severity of air pollution or have only recently recognized the significance of the problem. Among various types of pollutant locations such as water, soil, thermal, or as noise, air pollution is the most dangerous and severe, causing climate change and life-threatening diseases. According to the World Health Organization (WHO), 90 percent of the population now breathes polluted air and air pollution is the cause of death for over 7 million people each year. The health effects of pollution can be stroke, lung cancer, and heart disease. Furthermore, air pollutants have a negative impact on humans and the earth’s ecosystem as a whole, most specifically ozone depletion. Therefore, air quality monitoring and management are main subjects of concern for cities, states, and countries around the world.
Many cities are striving for a Smart City status – in order to comply with ISO 37122 – where air quality forms a vital part of the equation.
Developments in IoT technology have introduced a range of comparatively inexpensive air-quality and pollution sensors. While many low-end IoT sensors lack the high-degrees of accuracy that fixed stations provide, they still offer a good indication of air quality and pollution in specific locations without a high price point.
Rather than measuring gases in parts-per-billion(ppb), understand it more along the lines of a traffic light system with RED, YELLOW, GREEN as indicators for High, Medium, Low Risk values. With particulates – which is a vital component of the air quality index (AQI) – IoT sensors are just as accurate and a fraction of the price.
The Air Quality Index(AQI) is a standard for measuring and indicating air quality and pollution levels.
The air quality API endpoints provide information on the current and forecast of Air Quality Index (AQI). As defined by the EPA, the Air Quality Index is a common index for reporting air quality and indicating how clean or polluted the air. This can be often associated with potential health effects at certain high levels.
What can be measured?
The AQI covers a scale from 0 to 500 and is most commonly based on a weighted calculation of six (6) primary pollutants, including: ozone (O3), particulate matter of less than 2.5 micrometers (pm2.5), particulate matter of less than 10 micrometers (pm10), Carbon Monoxide (CO), Nitrogen Dioxide (NO2) and Sulphur Dioxide (SO2). The pollutants ozone, PM 2.5 and PM 10 are the most common.
The local authorities and councils can rapidly assess air-quality across vast areas of their area with IOT solutions. While this will not deliver laboratory-grade results, the IoT sensors will provide a good indication of air quality across large areas.
Not only will this give policy-makers a high-level view of the area in heat-map form, but it may highlight areas that require more focused measurement. All measurements taken by the system include GPS coordinates and time-stamps so that data can be analyzed by time-of-day, location and cross-referenced against weather data.
- Large Coverage Possible: IoT solutions allow you to measure quality over large areas, with no additional cost relating to staff or measurement overhead.
- Identifying pollution hotspots and problem areas: With expansive coverage, the system may identify anomalies or pollution hotspots that may warrant further investigation.
- Reduced Cost: IoT air quality and pollution sensors are cost-effective alternatives to fixed stations and can perform a crucial part of any holistic environmental management solution.
- Improving outcomes: Poor air quality and pollution levels have been linked to several health conditions and life
- Shaping policy and decision making: Data arms decision and policy makers. Town planners, population health, education leaders and transport managers can use air quality data to shape and develop policies for protecting populations and influence current as well as future decision making.
- Open Government: Many bodies choose to publicly share air quality information with their residents and businesses. This promotes transparency and garners support from people to support positive environmental change and help tackle climate issues.
To address the requirements for dynamic air quality modeling and forecasting, Clovity takes its algorithm and analysis expertise and pairs it with one of the leading weather data aggregators. Our collaboration with API providers and experience in modeling as well as forecasting delivered through Clovity’s sophisticated User Interface will ensure precise insights, accurate predictions and sophisticated real time alerts as well as updates.
Clovity has had the honor to work with city and state governments over the last few years on IoT and other development projects. As part of the Denver Smart City solution providers group, Clovity is part of a select list of IoT platform, development and peripheral vendors pre-selected to participate in upcoming IoT initiatives for the city ranging from Smart Pedestrian to Smart Air Quality. Furthermore, Clovity has helped extensively in Lake Nona, Florida one of the nations most advanced smart cities to achieve deeper insights from their sensor deployments.
Case in Focus: Air Pollution in Schools
Air pollution in and around schools is coming to the forefront because it has a direct health impact on kids. Reports from the WHO and UNICEF site studies that show air pollution hits children harder than adults and can lead to asthma as well as other respiratory issues.
The evidence also shows a relationship between exposure to ambient air pollutants and adverse effects on the development of lung function. Reversible lung function deficits, chronically reduced lung growth rates and lower lung function levels are associated with exposure to air pollution. Moreover, the evidence shows clearer relationships for particulate matter and traffic-related air pollution (indicated by nitrogen dioxide) than for other pollutants. Based on current knowledge, air pollutants seem to interact with other environmental factors, such as allergens, viruses, and diet that influence the overall impact of air pollutants on children’s health.

Children spend up to 40 hours a week in school or in childcare facilities. So in a way, that is almost 50% of the time they spend awake. So, it is little wonder that parents are eager to understand what steps teachers and administrators are taking to A) quantify the problem, and B) manage the effects.
Part of the problem is the location of most schools. Urban schools at least are often located near major roads – so they are easy for most of the school population to access. According to one study, 17,000 schools in rural and urban areas across the U.S. are located within 250 meters (~820 feet) of a heavily traveled road.
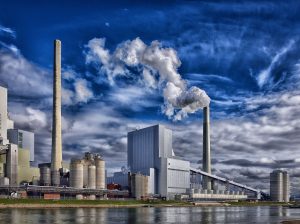
Perhaps unsurprisingly the United States Environmental Protection Agency has issued guidelines for schools. California Air Resources Board (CARB) says that no school should be built within 500 feet of a major roadway. This is great for schools that are yet to be built. However most schools were built long ago while the city has increasingly intensified around them. This has resulted in an increase in traffic and traffic-related pollution, new building construction pollution and more parking garages with high levels of carbon dioxide (CO2).
As awareness of air pollution and its effects particularly on children grows, so too does the pressure on schools to come up with an effective and coordinated response. The first and most logical place to start is measurement.
However, there is more than just health data that can be derived from monitoring the air quality. More so, contributing air quality data can benefit on-going planning as urbanization continues to push out into new developments. Providing insights to pollutants in surrounding areas can help determine where to build out schools and even other structures like healthcare facilities, elderly or aftercare facilities.
YOU CAN’T MANAGE WHAT YOU DON’T MEASURE
Schools and childcare centers come in different shapes and sizes – big or small, urban or rural, some are located on hillsides, some in valleys, near or far from freeways (a.k.a. motorways). Some may even be close to industrial pollution sources like power stations or manufacturing plants. As a result, there is no way to know what the air quality is like day over day without measuring it often.
Some schools rely on air quality information supplied by public or government-operated air quality monitoring stations. But this is problematic for several reasons:
- Some cities do not have any stations, so information is not accurate to the location.
- Those that do have a station do not cover the needed areas or not enough – Los Angeles for example has one station for every 800,000 people.
- The stations are often far away and not representative of the impacted areas which sends false positives.
- They do not pick up local pollution sources or are able to aggregate ‘at the edge’ so that inferences can represent the closest source as possible with high predictability.
- Many solutions do not have the artificial intelligence to account for microclimate effects e.g. strong winds carrying dust from a nearby pollution source.
- Providing one-hour lapsed data can miss patterns that occur during the day which may miss elevated pollution during those times like school pick-ups and drop-offs or during rush hour.
- Many of the legacy stations are huge and hugely expensive to maintain and even harder to integrate with, basically building more of these sites the last thing the government wants to do.
Therefore, relying on a public-produced or one-off air quality solution that cannot analyze or compute information may result in one of two things:
- A) it understates the problem for the school, or
- B) it overstates the problem for the school.
Either way the sensible thing to do is to carry out your own checks. This can be done cost effectively thanks to IoT, AI and digital technology that is affordable, reliable, and accurate. In today’s world, solutions like Air Quality are more science than art. Quantifiable results driving actionable decisions.
The good news is technology today has allowed for immediate identification, gathering and management of complex data models that can help make decisions based on factors found in Air Quality. However, to take on the complex aspect of Artificial Intelligence, Machine Learning, inference models, predictive algorithms, and on-going changes with technology, it can be very overwhelming to local government IT teams. Cities must determine whether to buy, build or outsource a solution. Aside from the technical complexity, we believe you cannot manage what you do not measure which means finding the right data science teams to help build configurable models that can learn, change and develop over time. To believe something exists without measuring it is like shooting at a target with a blindfold.
We believe we are the right technology partner to deliver and maintain a solution that is flexible and accurate. We have the experience to understand the complexity as well as the right tools to convey critical information with ease and visual simplicity. It is the systems’ job to measure, analyze and provide unified proof that Air Quality has a profound impact on daily lives both in good and bad ways.
We shall discuss our solution in the Part 2 of the Blog